Clinic By The Bay

Help Us, Help You
Functional service design for San Francisco’s premier free health clinic
Clinic by the Bay is a nonprofit, volunteer run, free health clinic located in San Francisco’s Excelsior neighborhood. The clientele at the clinic are primarily low income, working poor adults who do not have healthcare. Clinic by the Bay’s goal is to provide high quality, primary care to individuals who could otherwise not afford it. As a designer, my team and I were tasked with finding a means of actively measuring the outcomes and improving the in-house patient health coaching program. In order to do this, we began by asking ourselves how might we deliver a more seamless data tracking experience for the Clinic by the Bay health coaches.
Role & duration
UX Designer
2 week long client project
Team
Ana Shuleva - UX Designer
Taylor Cohen - UX Designer
Oletta Reed - UX Designer
Methods
User Archetypes, User Interviews, User Journeys, Affinity Mapping, Competitive and Comparative Analysis, Survey Creation, Service Design, Service Blueprint
Client
Clinic by the Bay
The Client
A growing nonprofit dedicated to healthcare
Clinic by the Bay came to my design team and I with a problem — “how do we prove the effectiveness of our new health coaching program?” The program primarily focuses on helping patients manage chronic conditions and improve their overall health. The health coaching sessions typically last one hour, and provide the patient with an opportunity to speak one-on-one with a coach who assists them in creating a specialized health-plan to meet their specific health goals. At first glance, it seemed simple enough — we need to find a way for the clinic staff to measure and record data that will show that the health coaching program results in positive patient health outcomes. However, like most “simple enough” solutions, we quickly found out that we had our work cut out for us.
The Challenge
Struggling to measure patient outcomes
Clinic by the Bay can’t prove the effectiveness of the health coaching program because of inconsistent, inaccessible, or absent patient data. While there are qualitative patient assessments and health coach anecdotes, Clinic by the Bay needs the quantitative data to back these stories and validate this program works to provide positive patient outcomes.
The Proposed Solution
Creating a system to serve with
In our interviews, we learned that the Health Coaches need a means of collecting patient data that can directly be correlated to positive patient health outcomes. In order to take actionable steps towards this goal, we decided to streamline the manner in which data is collected, recorded, and reviewed by the Clinic by the Bay staff. Collecting more structured data, will provide Clinic by the Bay with meaningful patient outcomes results that will allow them to secure more funding to grow the health coach program.
Measuring Effectiveness
What does success really mean?
How will Clinic by the Bay know that our proposed solution has yielded positive results? Well, since our primary focus was on creating a system for them through which they can collect structured data in the pre and post surveys and synthesize this data into meaningful reports, they will be able to evaluate the health coaching program’s effectiveness through future generated reports.
First Steps: Discovery
Research before design
Research was the fist step in our design process. During this stage, we asked ourselves, as well as others, numerous questions aimed at helping us flesh out our problem, and lead us to our solution.
User Interviews
“Tell us about yourself?”
At the start of our project, it was not immediately clear what our problem was. The information we received in regards to what the key pain-points where for the health-coaches and the clinic staff was scattered and vague. As a team, we decided to remedy this by conducting 6 interviews with clinic staff over a series of two weeks. During this process, we often found ourselves returning to the individuals we interviewed to ask them more questions, as more information was gathered from other staff members, more discrepancies arose.

Affinity Mapping
Visualizing the common pain-points
We decided to conduct an affinity map in order to better visualize the clinic’s pain-points and constraints, as well as be able to better recognize the most commonly encountered themes and statements of the clinic members.


From Interviews To Insights
How does this all fit together?
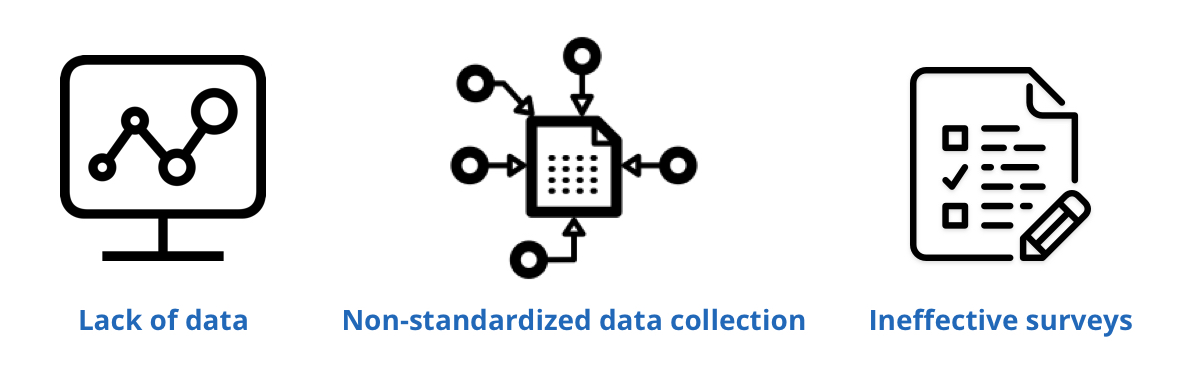
After conducting all of our client interviews, we came away with 3 key insights:
Clinic by the Bay struggles with data analysis because they do not collective enough data in order to be able to track patient progress and produce meaningful results.
The system by which staff members are collecting data is not standardized, which makes accessing data after the fact both difficult and useless.
The survey’s currently being used by the health-coaching staff ask questions that may lead to confirmation bias, are not implemented enough to consistently track patient progress, and are not being recorded in a manner that can easily generate reports.
Understanding The Evolution
Mapping the stages the clinic has passed through
In order to help the health coaching staff meet their goal of tracking patient health outcomes, we took a close look at the evolution of the program itself, and created a visual rendering of how the health coaching program has grown in recent years.

Digging Deeper
How does staff behavior inform service?
Rather quickly, my team and I learned that just looking at the health coaches was not enough in order to understand how the clinic runs. While fully understanding the clinic’s health coaching program as it stands today, as well as what it can offer in the future, was a good initial start in beginning the process of creating a more in-depth service blueprint, we decided that it did not provide us with enough information. Thus, the next step in our design process became gaining a better understanding of the different relationships between clinic staff, and using that information to generate a service ecology map.
Service Ecology Map
Understanding the interplay of dependent relationships
The service ecology map allowed our design team to better understand how each member of the clinic functions and interacts in relation to each other. Being able to quickly identify relationships between clinic members helped us to define what kind of proposed service changes would be possible.

User Personas
Who can we best help?
Once we understood how clinic staff functioned in relation to each other, it was time to look at them once more as individuals. I created several personas that highlight each staff members unique set of needs, barriers, and goals.

Service Blueprint
The Design
Since we now had a working knowledge of how the clinic functioned, and the different motivations and pain-points of it’s staff members, we created a service blueprint in order to visually identify the paint points of the clinic, and how they could be alleviated. We choose to focus on two specific areas of the clinic that could be improved: The first was within the health coaching program itself. The second related to data collection and analysis.

The Health Coaching Program
Designing for structure and consistency
After interviewing several of the health coaches at Clinic by the Bay, we came away with a few recommendations for improvement. We learned that each of the health coaches has a different method of collecting and transferring the data they receive during coaching visits. The lack of standardized questions, surveys, documentation techniques, and filing protocol has lent itself to data loss within the clinic, as well as an an excess assortment of unorganized patient information. Our solution to this was to create a standardized practice by which coaches conduct their sessions, mainly by refining the surveys that they use, how they transfer and record data, and the rate at which they do so.
The Surveys
Eliminating confirmation bias
The surveys that were being used by the Clinic by the Bay health coaches lent themselves to confirmation bias, featured repetitive questions, and used leading language. The clinic had five different pre-surveys and post-surveys for patients to fill out depending on the condition they were working to alleviate. However, after reviewing the surveys, we learned that they could be condensed into a single pre and post survey, as the main difference hinged entirely upon one question: patient diagnosis. We simplified and rewrote some of the survey questions as well in order to create a standard through which data could be obtained and examined.
Comparative and Competitive Analysis
How are others doing it?
Once we realized that the current surveys being utilized by Clinic by the Bay were not adequate in meeting their goals, we decided to look at other survey providers and methods that could help them seamlessly digitize their survey process. We compared their paper survey method against directly imputing survey info into their EHR (electronic health record) system. We also looked at 3rd survey providers in order to maximize the amount of viable options we could provide the client with.

The Solution(s)
Improvements to the data collection process
Patient vitals
Prior to our re-design, Clinic by the Bay health coaches had not been collecting any vitals data from patients during their health coaching meetings; this includes blood pressure, weight, and temperature. In our service blueprint, we recommend that vitals are collected, input into the electronic health tracking system, and later utilized to generate patient progress reports. We created a timeline that the clinic should follow in order to ensure that data is consistently collected, and can later be used to generate a statistical report. We believe that this is a quick and easy means of attaining reliable data that can be later used to track patient outcomes.
Session notes
Since each coach has a different method of taking notes during the patient sessions, we recommended streamlining the process by having all coaches ask a short series of the same questions in order to consistently measure patient results in a way that could be charted. Additionally, we also recommended that coaches input that data into the EHR system Athena immediately post session in order to ensure accuracy and prevent data loss.
Pre and post surveys
In addition to revising and redesigning the pre and post health-coach surveys, we also created a timeline that surveys should be implemented. We recommended that patient vitals and goals be taken at every health coaching meeting (and recorded in the health coaches notes within the EHR system)and that pre and post surveys are administered every three months. We choose to recommend a three month timeframe because our research pointed to that being an adequate amount of time for patients to begin to start seeing improvements in their health.

Survey Revision
Goal 1: Collecting consistent data
In addition to revising the health coaching surveys that were already being implemented by clinic staff members, we also recommended that surveys be administered more frequently. There was no practice in place as to when to issue a patient progress survey, so my team and I decided upon the three month mark as the most appropriate as it is enough time to see potential progress, but not too much time to potentially have a patient drop from the program. Our main reasoning behind this revision was that the high patient drop-off rate, coupled with infrequent survey administration, lead to a general lack of data that made patient outcomes difficult to measure, especially when patients dropped out of the program.
Goal 2: Reducing false information
After reviewing the surveys used by the health-coaches when a patient enters and graduates the program (6 months), we identified several opportunities for improvement and process simplification.
Our primary goal was to reduce any potential confirmation bias. Many questions were phrased in a way that were leaning, and could provide coaches with inaccurate results; survey questions were written in a manner to glean answers that the health coaches would want to hear as opposed to the patients actual progress.
Our secondary goal was to reduce redundancies by consolidating multiple surveys into one.

Next Steps
Prepping the clinic for further growth
The current recommendations that we believe should immediately be implemented by Clinic by the Bay include:
Collect vitals during health coaching visits so that Clinic by the Bay will have measurable data
Build survey questions into Athena
Potentially look into a third-party survey service that can generate reports
Provide additional training to health coaches regarding Athena input capabilities
Future implementation includes:
Marketing the health coach program
Improving patient incentives to health coaching engagement
Open Hand partnership
Improve Clinic by the Bay website interface to encourage donations and increase cash flow
Results & Reflections
The main takeaways
Telling stories is just as important (if not more) as listening: In order to properly synthesize and make sense of our research, we really have to understand our clients goals and motivations — even when they do not directly verbalize them. Sometimes, it takes a bit of investigative work.
Visualize things to see patterns: One of the most helpful tools my team utilized during this project was our affinity map. Since we gleaned so much information during our interviews, it was incredibly helpful to be able to sift through it visually.
Collaboration is key. No more needs to be said here.